The Reference Amount Customarily Misunderstood
How a number meant to compare crackers quietly became a tool for hiding calories.
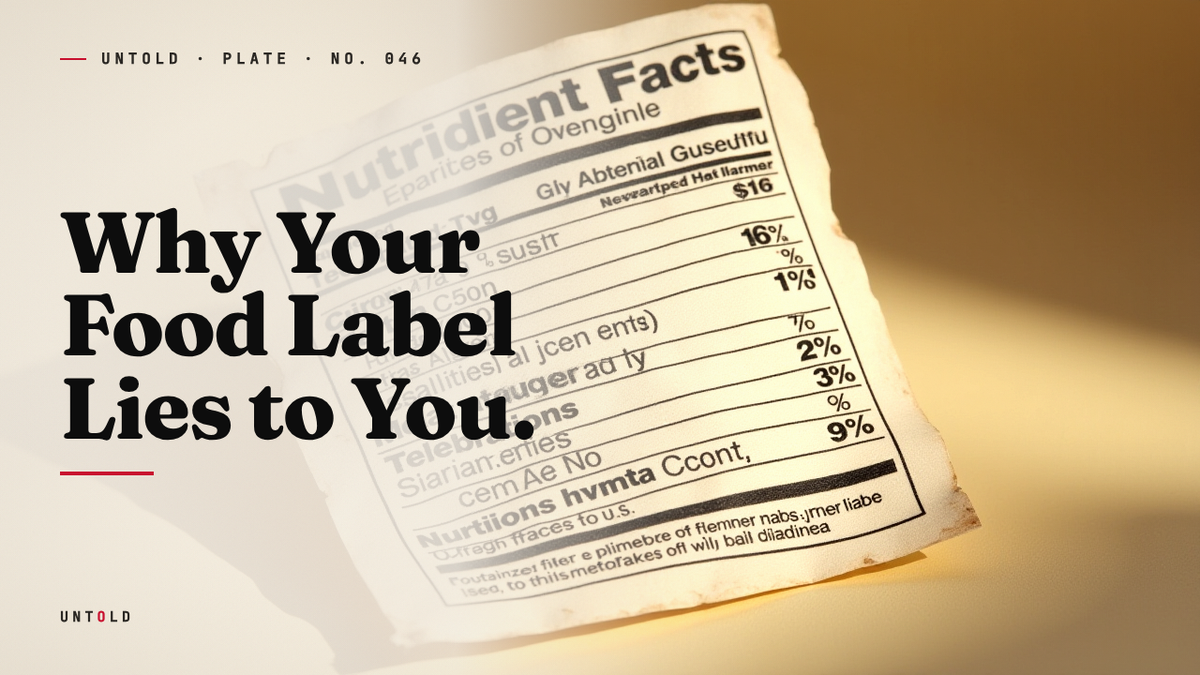
A bag of potato chips sits on the counter. The front of the package, in confident type, reports 150 calories. That is a reassuring figure, the kind a person can absorb without guilt and move on. Then comes the small print near the barcode, the line nobody reads until the bag is already half gone: Servings per container: 3. The math arrives a beat too late. The person did not eat 150 calories. They ate 450, and they ate them without ever feeling they had been told otherwise.
This is not fraud in the legal sense. No regulator would call it a lie. Every number on that package is technically accurate, audited, defensible in court. And yet the experience of reading it is one of being misled, gently and repeatedly, by a document designed to inform. The gap between what the label says and what the body does is one of the quietest distortions in modern eating, and it has been hiding in plain sight, in eight-point font, for more than thirty years.
To understand how a measurement became a marketing instrument, it helps to go back to a moment when the United States had almost no rules about food labels at all, and to the law that tried to fix that, and the strange, frozen unit it left behind.
A standard built to compare, not to advise
Before 1990, the American grocery aisle was a Tower of Babel. There was no required format for nutrition information, no agreed-upon unit, no way to set two boxes of cereal side by side and know which one was lighter. One brand might list calories per ounce, another per cup, another per some idiosyncratic portion the manufacturer had invented for reasons of its own. Comparison was nearly impossible by design. A shopper trying to make a careful choice was navigating without instruments.
The Nutrition Labeling and Education Act of 1990 changed that. Signed into law and enforced by the Food and Drug Administration, it required standardized Nutrition Facts panels on most packaged foods for the first time in the country’s history.1 The man at the center of the effort was David Kessler, the FDA commissioner who pushed for labels that were clear, consistent, and comparable. Kessler later became one of the most outspoken critics of how the food industry engineers products to be overeaten, but in the early 1990s his immediate problem was simpler. He wanted a person to be able to compare a cracker to a cracker.2
To do that, regulators needed a fixed unit. You cannot compare two foods unless you measure them against the same yardstick. So the FDA created something called the Reference Amount Customarily Consumed, abbreviated, with bureaucratic poetry, as RACC. The reference amount was the agency’s best estimate of how much of a given food a typical person ate in a single sitting. Crackers had a reference amount. Ice cream had one. Soda had one. Every category was assigned a number, and that number became the basis for the serving size printed on the label.
Here is the crucial point, the one that almost everyone misses. The reference amount was never intended as a recommendation. It was not the FDA telling you how much to eat. It was a statistical anchor, a shared denominator that let the calories in one brand of ice cream be compared honestly against another. The serving size answered the question how much do people typically eat, not how much should you eat. It was a description dressed in the clothes of advice, and the confusion between those two things would prove enormously consequential.
The reference amounts were drawn from national food consumption surveys conducted in the 1970s and 1980s. At the time, they were a reasonable snapshot of American eating. The trouble was that they were a snapshot of a moment that did not stay still.
The portion that would not stop growing
The reference amounts were frozen. American portions were not. Over the decades that followed the 1990 law, the actual quantities people ate quietly inflated, and the gap between the official serving on the label and the real serving in the hand widened year by year.
The person who documented this with the most precision was Lisa Young, a nutritionist at New York University who spent years doing something deceptively simple: measuring food. She tracked the real-world sizes of everyday items over time, weighing and recording how bagels, muffins, sodas, and cookies had changed.3 Her findings, laid out in her academic work and later in her book The Portion Teller, read like an archaeology of excess. A bagel from the 1980s was a modest object, around three inches across and roughly 140 calories. The contemporary bagel had swollen to nearly six inches and well over 300 calories, holding double the energy of its ancestor while occupying the same word on a menu.4
Young’s broader argument, which she made repeatedly in the nutrition literature, was that portion sizes had grown in tandem with rising body weights, and that the two trends were not coincidental.5 As plates, cups, and packages expanded, so did the amount people considered normal to eat in one sitting. The portion was not a fixed biological fact. It was a cultural artifact, and the culture had decided that bigger was better, then quietly redefined bigger as standard.
Meanwhile the serving size on the label sat unchanged, anchored to surveys from a leaner era. This created a peculiar and useful loophole. Because calories on the Nutrition Facts panel were reported per serving, and because the serving was often smaller than what anyone actually ate, the calorie figure on any given package could be made to look reassuringly modest. The number was honest. The framing was not.
Consider the muffin sold as containing two servings. The total calorie count of the object might be alarming, but split across two servings on paper, each line looks half as frightening. Nobody eats half a muffin and wraps the rest for later. The muffin is a single object, consumed as one. But the label, dividing it in two, performed a small act of accounting magic that let the manufacturer present a kinder number while changing nothing about the food itself.
The label was not lying. It was hiding. And what it hid behind was a technicality so subtle that most shoppers never noticed it was there.
We eat with our eyes
Even if every shopper read the serving size carefully and did the arithmetic flawlessly, it might not matter much. Because the deeper problem is that the number on a label has almost no influence over how much a person actually eats. The decision is made elsewhere, by the eyes, by the size of the container, by a set of cues that operate well below the level of conscious calculation.
The researcher most associated with this insight was Brian Wansink, who spent years at Cornell studying the psychology of consumption. His most famous experiment involved a bowl of tomato soup. Diners sat down to eat, but some of the bowls were secretly rigged, connected by hidden tubes that slowly refilled them from below as the soup was consumed. The bowl, in other words, never emptied. People eating from these self-refilling bowls consumed about 73 percent more soup than those eating from ordinary bowls, yet when asked afterward, they did not believe they had eaten any more than usual. They reported feeling no fuller. They had no idea.6
The lesson Wansink drew was blunt: people do not monitor their stomachs to decide when to stop eating. They monitor their environment. An empty bowl, a finished plate, the visible bottom of a bag. These are the signals that end a meal, not any internal sense of having had enough. We eat with our eyes, not our stomachs, and the eyes are easily fooled.
It is worth pausing on Wansink here, because his story complicates the science in an instructive way. In the years after his most celebrated findings, several of his studies were found to contain serious statistical and methodological problems, and a number of his papers were retracted following investigations into his research practices. The bottomless bowl finding has held up better than some of his other work, and its core conclusion, that container size and visual cues drive consumption, is supported by a large independent body of research. But the episode is a reminder that even compelling science deserves scrutiny, and that the portion-size story does not rest on any single laboratory.7
What survives the scrutiny is robust. A wide range of studies, by many different teams, have shown that larger packages, larger plates, and larger serving vessels reliably lead people to take and finish more food, regardless of what any label says about a serving.8 The bigger the plate, the more we serve ourselves. The more we serve, the more we finish. The container, not the number, dictates reality. And the serving size, that carefully calculated reference amount, exerts almost no gravitational pull on actual behavior.
This is the heart of the matter. Companies are not obligated to design their packages to be eaten in two or three sittings, and they have little incentive to. A package designed to be finished in one go sells more product. So the container and the serving size pull in opposite directions: the container engineered for a single sitting, the label divided into fractions that no one observes.
The math of a single bottle
Nowhere is the gap clearer than in a bottle of soda. A standard 20-ounce bottle, the kind sold at every checkout counter and gas station in America, historically listed itself as containing 2.5 servings. The calorie figure was reported per serving, roughly 100 calories, a number the drinker might glance at and feel fine about.
But almost no one drinks a fifth of a bottle of soda and screws the cap back on for later. The bottle is sold as a single-serve item, held in one hand, consumed in one event. The actual delivery is closer to 250 calories, a figure the label technically disclosed and effectively concealed, splitting it across servings that did not correspond to any real act of drinking.
Now multiply that gap. A daily bottle, the difference between the 100 calories a drinker counts and the 250 they consume, compounds across weeks and months into a surplus large enough to matter for the body. The distortion is small per instance and enormous in aggregate. This is how a labeling technicality, defensible in every individual case, accumulates into a population-scale problem. The numbers were never wrong. They were just arranged in a way that made the truth easy to miss.
Regulators were aware of this. For decades the FDA knew that the serving sizes on labels no longer matched how Americans actually ate, that the reference amounts from the 1970s described a country that had since changed its appetites. The yardstick had stopped matching the thing it measured. The question was whether anyone would update it.
What the label was for all along
It is tempting to end the story here, with the serving size cast as a villain, a deliberate deception engineered to fool the public. But that framing gets something important wrong, and the correction is the most interesting part.
The serving size was never meant to tell anyone how much to eat. That was not its job. It existed to standardize comparison, to let one product be measured against another on equal terms. It was a tool for the aisle, not for the appetite. The reference amount answered a descriptive question, how much do people typically consume, and it was only ever a statistical estimate, not a prescription.
The real distortion, then, is not the number itself. It is the way the number gets read. People treat the serving size as advice, as a quiet recommendation about how much they ought to eat, when it was only ever a denominator built for comparison. The label was honest about what it was. The misunderstanding was ours, and the food industry simply declined to correct it, because the misunderstanding worked in its favor. A reference amount that happened to make calorie counts look small was a reference amount worth leaving alone.
In 2016, the FDA finally moved to close the gap. It updated the serving sizes on the Nutrition Facts panel to reflect how people actually ate, the first major revision in a quarter century.9 Ice cream’s serving rose from half a cup to two-thirds of a cup. A 20-ounce soda became a single serving rather than an awkward two-and-a-half. The reference amounts were dragged forward in time, finally catching up to the country they were supposed to describe. The new rules took effect in 2020, nearly thirty years after the original law.10
It was a genuine improvement. A 12-ounce can of soda now reports its full calorie load as one serving, and the muffin can no longer hide quite so comfortably behind a fractional accounting. But the update reached the limit of what any label can do. A number printed on a package, however accurate, cannot measure the bowl in front of a particular person on a particular evening. It cannot see the size of the plate or the depth of the bag. It can inform. It cannot decide.
What the serving size finally reveals, when you understand what it is, is the boundary between information and behavior. The label was never the thing eating the food. The label was a reference, a comparison, a tool with a narrow and legitimate purpose that we asked to do a job it was never built for. The number describes a custom. The hand makes a choice. And the only question the label cannot answer, the one worth asking every time the package is flipped over, is the simplest: how much am I actually eating?

Sources
- U.S. Food and Drug Administration, Nutrition Labeling and Education Act of 1990, FDA, 1990. — https://www.fda.gov/food/food-labeling-nutrition/changes-nutrition-facts-label
- Kessler, David A., The End of Overeating: Taking Control of the Insatiable American Appetite, Rodale, 2009. — https://en.wikipedia.org/wiki/The_End_of_Overeating
- Young, Lisa R. and Nestle, Marion, The Contribution of Expanding Portion Sizes to the US Obesity Epidemic, American Journal of Public Health, 2002. — https://ajph.aphapublications.org/doi/10.2105/AJPH.92.2.246
- Young, Lisa R., The Portion Teller Plan, Morgan Road Books, 2005. — https://en.wikipedia.org/wiki/Lisa_Young
- Young, Lisa R. and Nestle, Marion, Expanding Portion Sizes in the US Marketplace: Implications for Nutrition Counseling, Journal of the American Dietetic Association, 2003. — https://pubmed.ncbi.nlm.nih.gov/12669009/
- Wansink, Brian, Painter, James E. and North, Jill, Bottomless Bowls: Why Visual Cues of Portion Size May Influence Intake, Obesity Research, 2005. — https://onlinelibrary.wiley.com/doi/10.1038/oby.2005.12
- van der Zee, Tim, Anaya, Jordan and Brown, Nicholas J. L., Statistical heartburn: an attempt to digest four pizza publications from the Cornell Food and Brand Lab, BMC Nutrition, 2017. — https://bmcnutr.biomedcentral.com/articles/10.1186/s40795-017-0167-x
- Hollands, Gareth J. et al., Portion, package or tableware size for changing selection and consumption of food, Cochrane Database of Systematic Reviews, 2015. — https://www.cochranelibrary.com/cdsr/doi/10.1002/14651858.CD011045.pub2/full
- U.S. Food and Drug Administration, Changes to the Nutrition Facts Label, FDA, 2016. — https://www.fda.gov/food/food-labeling-nutrition/changes-nutrition-facts-label
- U.S. Food and Drug Administration, Reference Amounts Customarily Consumed: List of Products for Each Product Category, FDA, 2018. — https://www.fda.gov/regulatory-information/search-fda-guidance-documents/guidance-industry-reference-amounts-customarily-consumed-list-products-each-product-category
Related reading